We are nearly across the finish line in how to optimally position your organization to attract needed workers. Here’s a recap of the steps we’ve taken so far in this series:
- Set the stage by understanding the reality of the hiring landscape in Washington County.
Read: Shift the Hiring Imbalance Your Way - Determined the Knowledge, Skills, and Abilities (KSA’s) for our example “general laborer” need and translate that info into a compatible occupational code that gives us the broadest reach (in this example “Laborers and Freight, Stock and Material Movers” with an SOC of 53-7062).
Read: Frame Up the Pool of Talent You Need - Determined the optimal wage that maximizes the available talent pool before reaching diminishing returns (in this example we came up with $18 per hour based on the data).
Read: What to Pay to Secure the Talent You Need
None of this work matters, however, unless we know where we are more likely to succeed in attracting the workers we need. Consider this DIY approach as a “napkin analysis” to target recruitment. While there are a variety of factors that go into attracting new workers (like your workplace culture and / or benefits program as examples), we are focusing on the top two: (1) number of workers with your requisite KSA’s and (2) starting wages.
Our DIY approach below applies for any position you need; so, let’s get at it!
Step 1: Download our Little Excel “Cheat Sheet” We Whipped Up for You
The Excel workbook has tabs showing this example and a template tab that’s blank for you to use on any position of your choosing.
Step 2: Fill Out the Data Search Form at the WisConomy Website
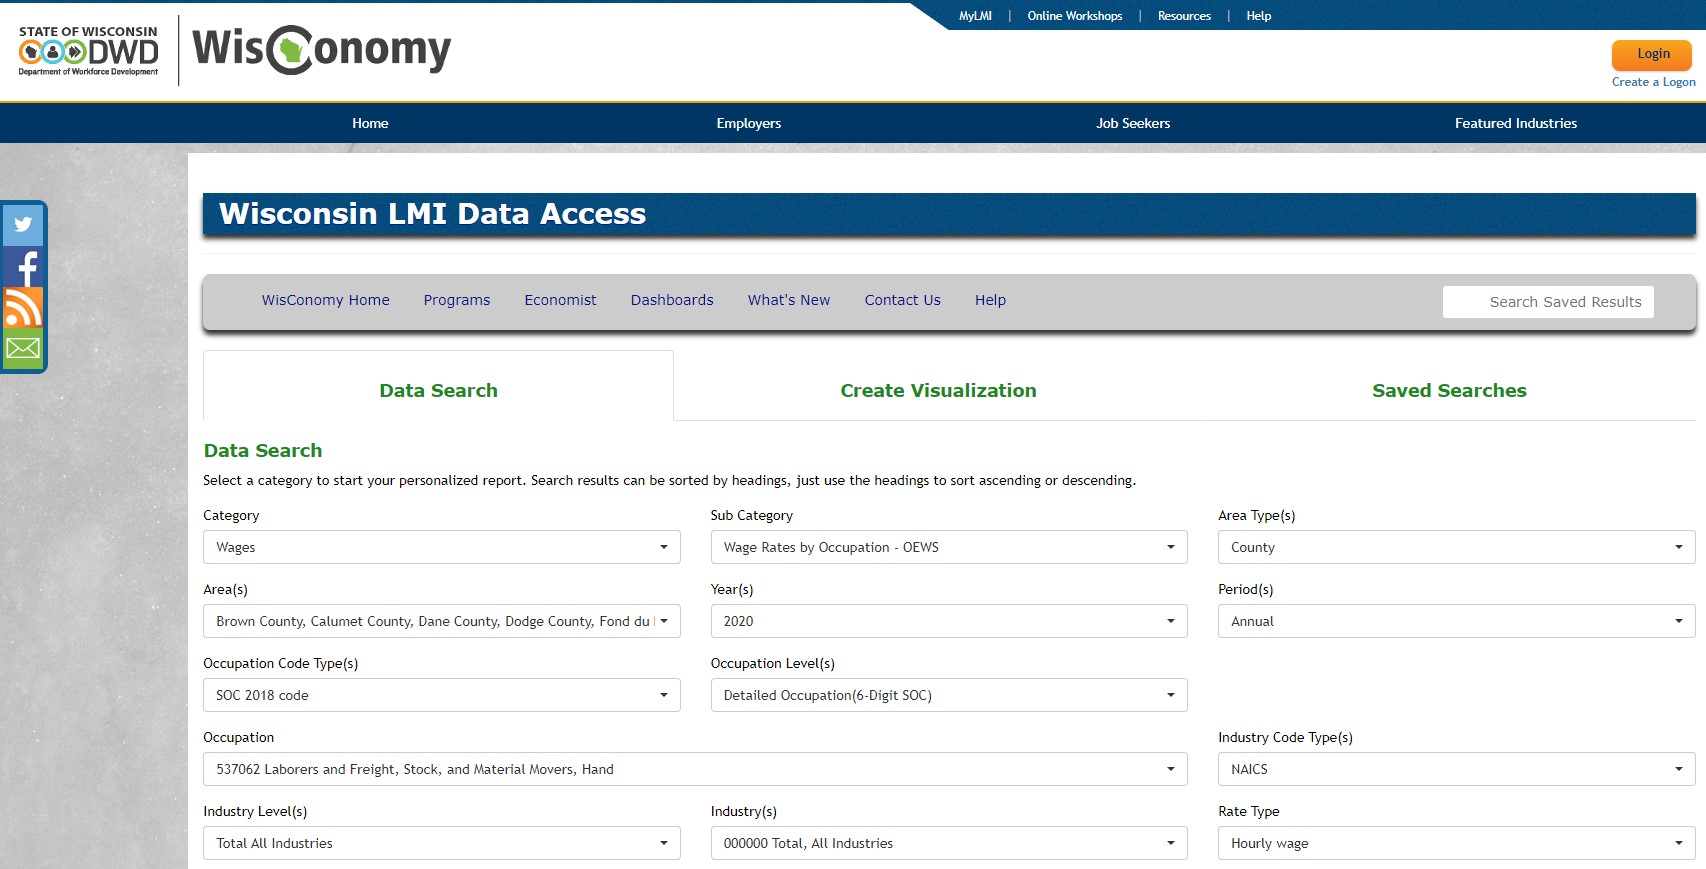
 The form guides you step-by-step through your options. Here’s how you’ll make your selections:
- Category – Wages
- Sub Category – Wage Rates by Occupation (OEWS)
- Area Type(s) – County (that’s the smallest unit unfortunately)
- Area(s) – Check each county from where you may wish to recruit (check however many you wish)
- Year(s) – Most recent, “2021” will come up by default
- Period(s) – “Annual” will come up by default
- Occupation Code Type(s) – “SOC 2018 Code” will come up by default
- Occupation Level(s) – Select “Detailed Occupation (6-Digit SOC)”…or the most drilled down level you can
- Occupation – Type in the SOC for your target occupation. See previous blogs in this series for how to come up with your SOC. For the example here, enter SOC of 537062 “Laborers and Freight, Stock and Material Movers.”
- Industry Level(s) – “Total All Industries” will come up by default.
- Industries – “000000 Total, All Industries” will come up by default.
- Rate Type – Select one or both (hourly, annual) as most appropriate for your occupation. For this example, “Hourly Wage” makes most sense.
Step 3: Click “Generate Report” and Download into an Excel Worksheet
Click the “Download” tab followed by the “Download” button. Open the Excel worksheet that downloads into your downloads folder. You can move this worksheet into the Excel workbook EDWC created. We did this already for the example occupation and included it as the “WisConomy Example Data” tab.
Step 4: Copy the Data into the “Template Napkin Analysis” Tab and Input the Other Driver Assumptions You Would Like to Use
The only columns you need from the WisConomy data are: Area, Employment and Mean Wages. Hide the others. The template we created for you is in the same order; so, you can now copy and paste the data downloaded from WisConomy into the template as one block…easy. Once you enter in the other assumptions, the “Commute Not Factored” columns will automatically calculate. We did this already for our example, which you can see in the “Example Analysis” tab.
Optional: We set up our Excel template to allow you to account for any “extra” commute expense that accrue from recruiting locations that are further afield than the average drive of your workers for that occupation. All you have to do is enter an average 1-way commute distance assumption for your workers (everyone has to drive at least some to work…and so that shouldn’t count) and the distances to your target recruitment areas, and the worksheet calculates the rest for you.
Step 5: Analyze the Results. Use the EDWC Workbook as a Starting Point…Make it Yours
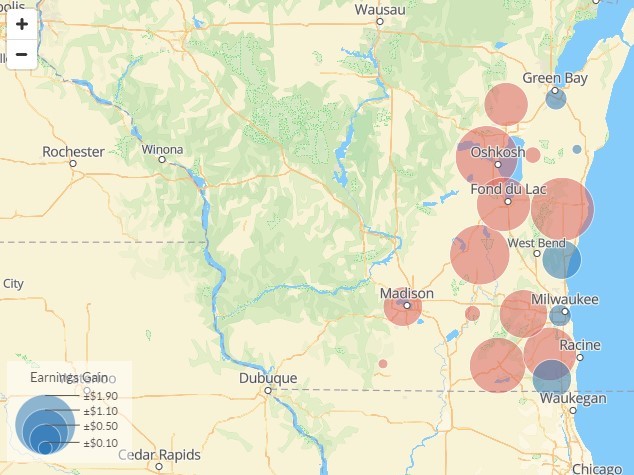
The assumption here is – all other things being equal – employees will consider your company if they can make more $ at your place of employment than where they are now. Keep in mind, some of the employees you are looking to recruit already live in Washington County but are today commuting outside to a “Target County” for work; so, the “Commute Not Factored” calculations are useful (their drive times shorten for added savings above any earnings gain). Other employees live in a “Target County” and would need to consider an added commute expense to work for you; hence, looking at the “Commute Overage Factored” calculations may make more sense. Examining our “Example Analysis” tab, a couple of target counties rise to the surface for both instances: Ozaukee and Dodge. Recruiting from select markets within Washington County also makes sense given your premium above the county’s mean (average) for this example occupation.
Kicking it Up a Notch
 This DIY approach is admittedly “down-and-dirty.” If you are looking for targeting recruitment information that’s more sophisticated with more recent data and is cost-of-living adjusted, then look no further than EDWC. For a cost-effective fee, we can leverage our investment in real-time analytics tools provided by Lightcast (formerly Emsi Burning Glass) and ArcGIS Business Analyst to do the heavy lifting for you.
Click the link below for a sample report we prepared using Lightcast tools to uncover top regions we can target recruitment for our example occupation “Laborers and Freight, Stock and Material Movers.”
We can help you get better results from your recruitment efforts. Contact us today to get started.


