Shift the Hiring Imbalance Your Way Part 3: How Much Do I Need to Pay to Get Them?
So far, we’ve established local trends and framed up desired talent as part of our EDWC exclusive series on how to use real-time data to optimally position for attracting and retaining needed workers. Let’s now figure out how much we need to pay to secure them.
Publicly available wage data is often buried, difficult to navigate and dated. No worries, we offer you a few short-cuts here. EDWC utilizes our paid subscription with Emsi Burning Glass to secure good data and make at-a-glance and graphical meaning for decision-making; however, we also give you a couple of free DIY options via the website tips below.
You may recall we illustrated our approach using a fairly basic job need – “general laborer” – and found a different position with very close compatibility was giving us better data and a better sense of availability: “Laborers and Freight, Stock and Material Movers” with an SOC of 53-7062.
Begin with Your Pay & See What That “Buys” You
There is a mind-numbing sea of data sets out there for the DIY’er. We got you though: see our Pro Tips box for a nice tool that helps you find the right Bureau of Labor Statistics (BLS) data set to meet your needs. To get at this particular objective you are looking for data sets providing you numbers of employees and wages, breaking it up by quartiles (not just mean). Two decent ones that do this by guiding you through a sequenced menu of choices are:
- BLS Occupational Employment & Wage Stats Query System – https://data.bls.gov/oes/#/home (more current data but limited to larger geographies)
- WisConomy Engine – https://www.jobcenterofwisconsin.com/wisconomy/query (older data but available at county and labor supply geographies…including starting and experienced wages)
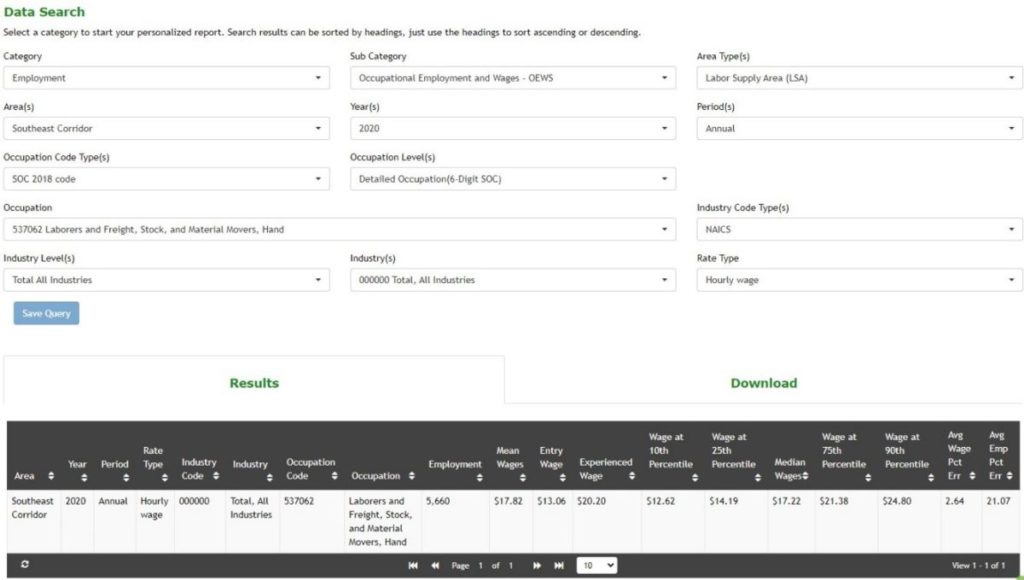
Here is a sample query from the WisConomy site.
To ease the work, improve usability and speed up decision-making; we’ll leverage EDWC’s Emsi Burning Glass partnership. Let’s say our wage is $16 per hour for “Laborers and Freight, Stock and Material Movers.” Here’s what we come up with:
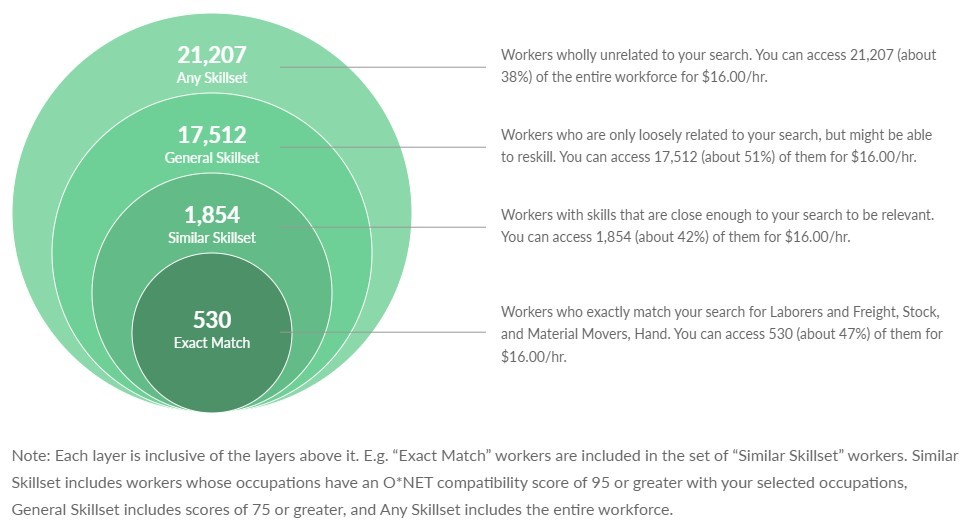
What we don’t yet know, however, is if that wage is optimized for accessing the most workers.
Optimizing Pay to Access the Greatest Number of Workers
Find the “Sweet Spot” Where A Small Push on the Wage Lever Results in the Largest Worker Gains
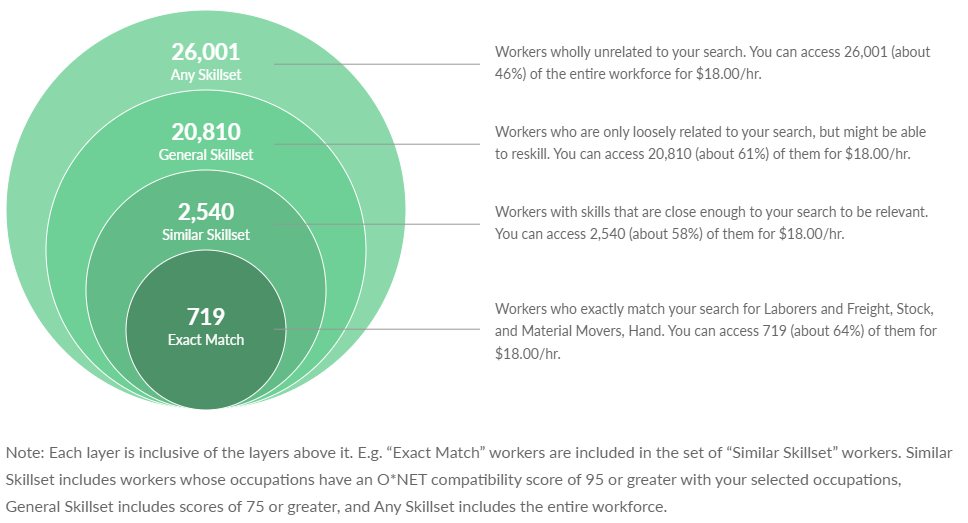
This takes finagling and multiple data sets from the free sources noted in this blog. Our tools, however, allow us to graphically map the added workers at each wage increment cross-tabbed with preferred skillset match. Doing this for our example job classification shows limited increases in availability with wage adjustments if we are looking for an exact skills match. If we can flex to allow for a “similar skills” match, an optimized wage of $18 per hour profoundly emerges. Anything after that starts to generate diminished returns.
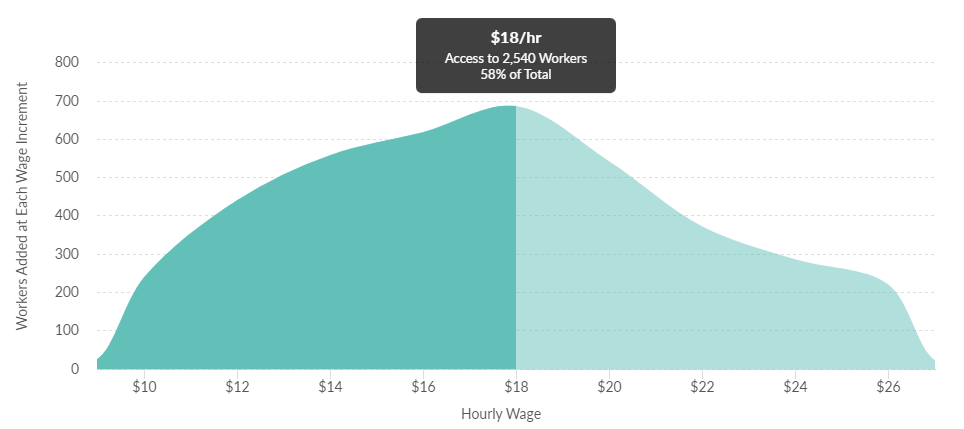
In summary, using this approach, we figured out we have optimized access to the workers we need for “Laborers and Freight, Stock and Material Movers” at $18 per hour in Washington County.
