This is the second of an EDWC exclusive five-part series where we’ll use real-time data to optimally position your organization for attracting and retaining the workers you need. Last week we leveraged real-time job posting analytics to uncover market insights on Washington County hiring. Today, we will use analytics to build a pool of talent and determine if you can find them around here.
To make this real and applicable to most, we’ll start with a fairly basic job need: “general laborer.” This approach works, however, for any job type in production, sales, administration, and engineering.
Start by Dialing into the Optimal Job Classification
Don’t box yourself in. Shed the internal title you use and instead list the knowledge, skills and abilities (KSA’s in HR speak) you require. From there, you can “crosswalk” to specific occupations for which you are seeking to attract workers. The goal is to identify a couple of Standard Occupational Codes (SOC’s) you can use target data and intelligence. At EDWC, we leverage our partnership with Emsi Burning Glass to do this efficiently and effectively for businesses; however, you can do a “lite” version of this for free at www.onetonline.org. Our competency list for “general laborer” includes: operation monitoring, operation and control, coordination / dexterity, critical thinking, reading and quality control.
Find a Compatible Occupation with a High Number of Area Jobs
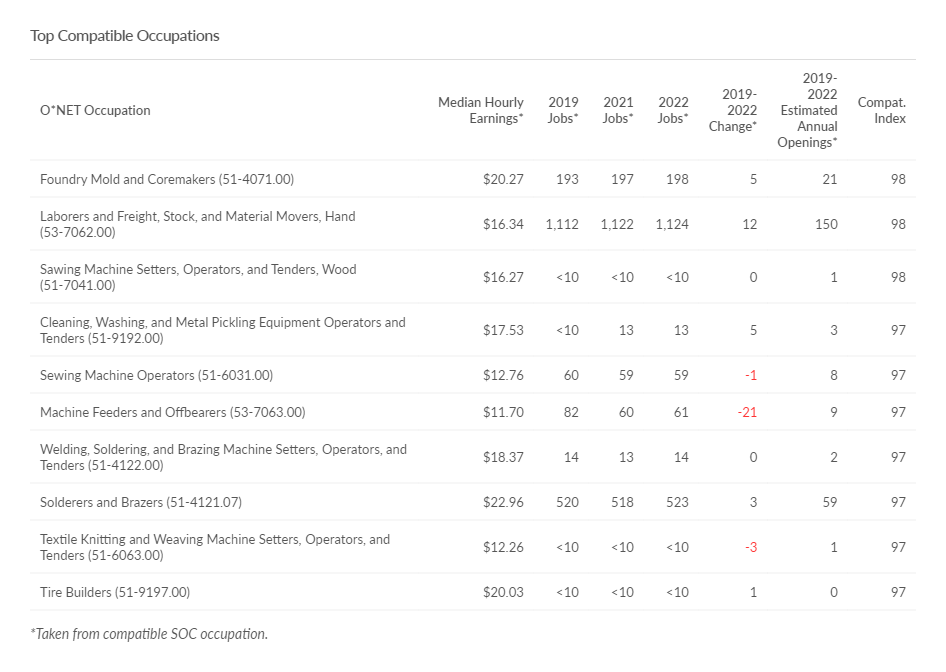
You can do this at the O*NET website. EDWC’s databases take the O*NET information on KSA’s and “crosswalk” to specific occupations and SOC’s via a “compatibility index.” We then pull all this data together to target a specific occupation with high numbers of jobs and compatible wages in our geography. Using the summary table of information we built here, we chose “Laborers and Freight, Stock and Material Movers” with an SOC of 53-7062. While technically from the transportation and materials moving industry, this occupation has a high compatibility index (98) with 1,124 jobs and a wage rate that works at a $16.34 per hour median.
Do a Deep Dive into the Data Around the Selected SOC’s
Your goal is to answer the question: Will I be able to find the talent I need?
There is a TON of free data out there you can find by Googling the specific SOC’s…too much really. I’d recommend starting here: https://www.bls.gov/regions/home.htm. EDWC gets to actionable insights more quickly by using our sophisticated analytics capabilities to produce concise, graphical intelligence.
Get EDWC’s full occupational snapshot report for “Laborers and Freight, Stock and Material Movers” by clicking here!
Here are some key insights we found for this occupation:
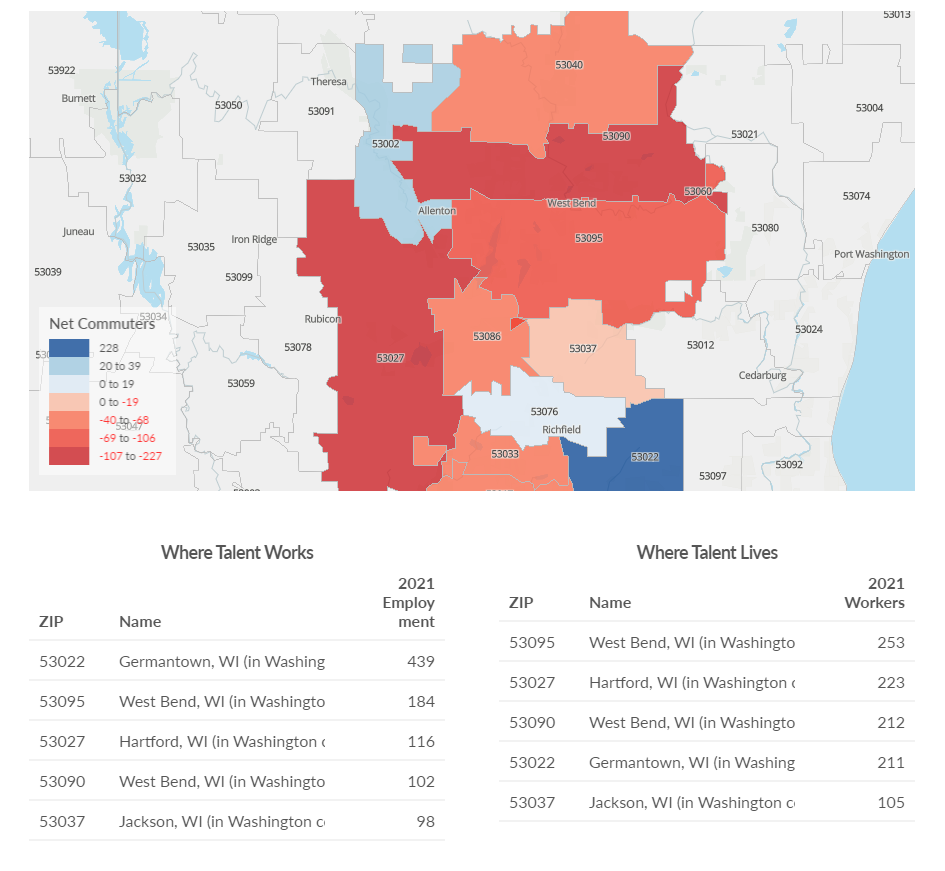
Place of Work vs. Place of Residence
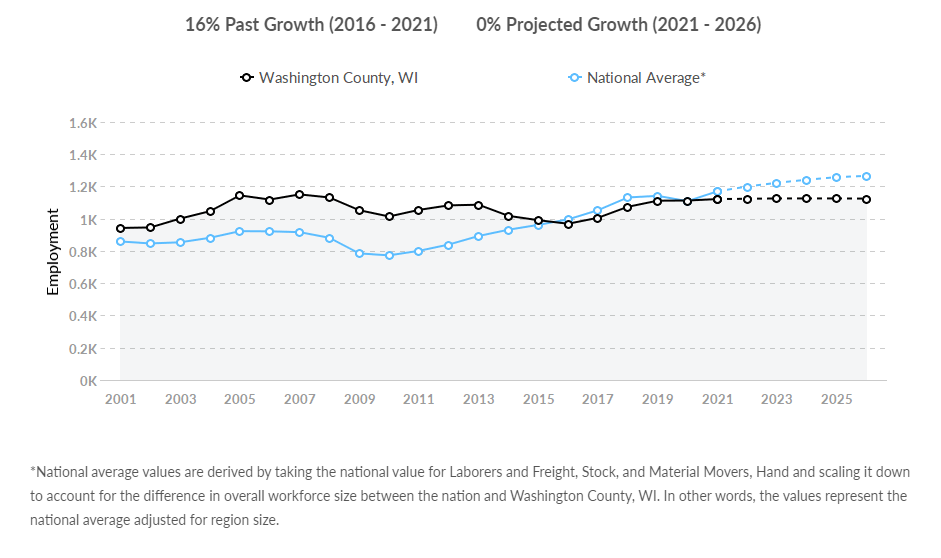
Regional vs. National Employment
This helps you get at supply and how it is changing relative to the nation.
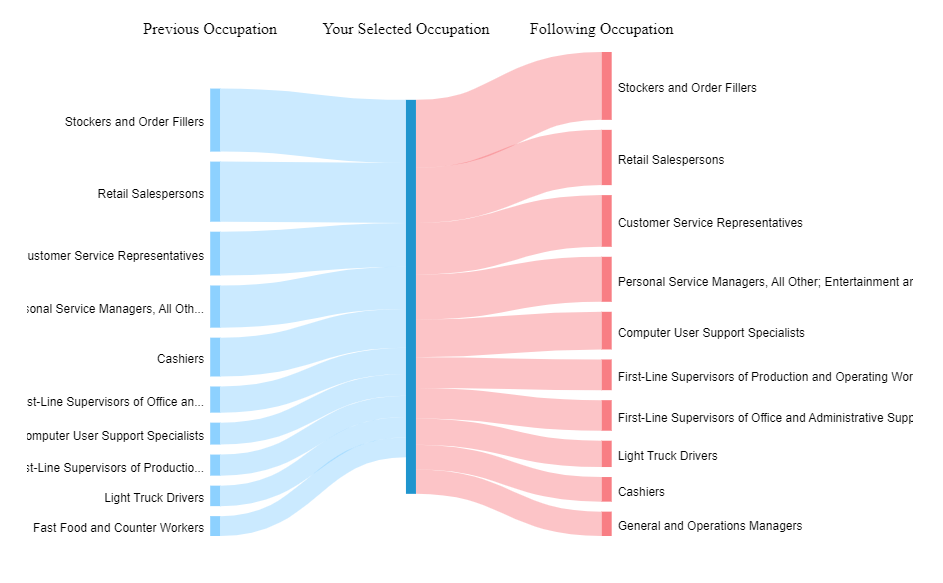
Occupation Gain and Drain
Building confidence around if you will be able to find the talent you need expands if you know all the places where folks are coming from in transitioning to your target occupation. Here’s what it looks like for Laborers and Freight, Stock and Materials Movers
Now that you have addressed the question of “Will I be able to find the talent I need,” Part 3 of our series on “Shifting the Hiring Imbalance Your Way” will address the question of “How much do I need to pay to get them?” See, I told you we had your back!


